
Prometheus是一个灵活的时间序列数据库和监控系统,有多个监控组件可用。Grafana是用于展示数据的平台。
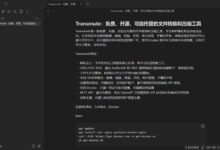
这几个工具我之前介绍过,不过当时我是用来做VPS的三网监控。实际上Prometheus能做的事情很多,就比如今天要介绍的全方位监控VPS主机运行状态。
prometheus和grafana为简化安装步骤,这里直接使用docker,首先你要安装docker/docker-compose:
apt -y update
apt -y install curl
curl -sSL https://get.docker.com/ | sh
systemctl start docker
systemctl enable docker
curl -L https://github.com/docker/compose/releases/download/1.25.4/docker-compose-`uname -s`-`uname -m` -o /usr/local/bin/docker-compose
chmod +x /usr/local/bin/docker-compose
然后新建一个docker-compose.yml:
mkdir -p /opt/monitor && cd /opt/monitor && nano docker-compose.yml
写入下面的配置:
version: '3.5'

volumes:
    prometheus-data:
    grafana-data:

services:
    prometheus:
        image: prom/prometheus
        container_name: prometheus
        ports:
            - 9090:9090
        volumes:
            - prometheus-data:/prometheus
            - ./prometheus.yml:/etc/prometheus/prometheus.yml
        command:
            - '--config.file=/etc/prometheus/prometheus.yml'
            - '--web.enable-admin-api'
            - '--web.enable-lifecycle'

    grafana:
        image: grafana/grafana
        container_name: grafana
        ports:
            - 3000:3000
        volumes:
            - grafana-data:/var/lib/grafana
接着新建prometheus的配置文件:
nano prometheus.yml
写入如下配置:
global:
    scrape_interval: 5s
    external_labels:
        monitor: 'imlala'

scrape_configs:
    - job_name: 'prometheus'
      static_configs:
          - targets:
                - 'localhost:9090'
            labels:
                instance: prometheus

    - job_name: 'VPS监控'
      static_configs:
          - targets:
                - '你小鸡的VPS公网IP:9100'
            labels:
                instance: localhost
          - targets:
                - '你的另一只小鸡的公网IP:9100'
            labels:
                instance: ikoula
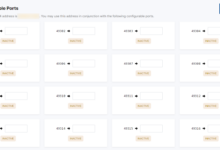
有多少台VPS就写多少个targets,labels是用于区分。
确认无误后up起来即可:
docker-compose up -d
如果后续你更改了prometheus.yml配置文件内容,可以直接执行下面的命令让prometheus热加载配置,不用重启prometheus容器:
curl -s -XPOST localhost:9090/-/reload
接下来我们需要在每台被监控的小鸡上安装node_exporter,node_exporter是prometheus的数据采集器。
node_exporter设计是用于监控主机系统的,因为它需要访问主机系统,所以官方也不推荐将node_exporter容器化,建议是直接部署在宿主机上。
下载解压移动到usr/bin目录下:
wget https://github.com/prometheus/node_exporter/releases/download/v0.18.1/node_exporter-0.18.1.linux-amd64.tar.gz
tar -xzvf node_exporter-0.18.1.linux-amd64.tar.gz
cd node_exporter-0.18.1.linux-amd64/
cp node_exporter /usr/bin
新建systemd服务文件:
nano /etc/systemd/system/node_exporter.service
写入如下配置:
[Unit]
Description=Node Exporter

[Service]
User=root
ExecStart=/usr/bin/node_exporter

[Install]
WantedBy=multi-user.target
启动/设置开机自启:
systemctl start node_exporter.service
systemctl enable node_exporter.service
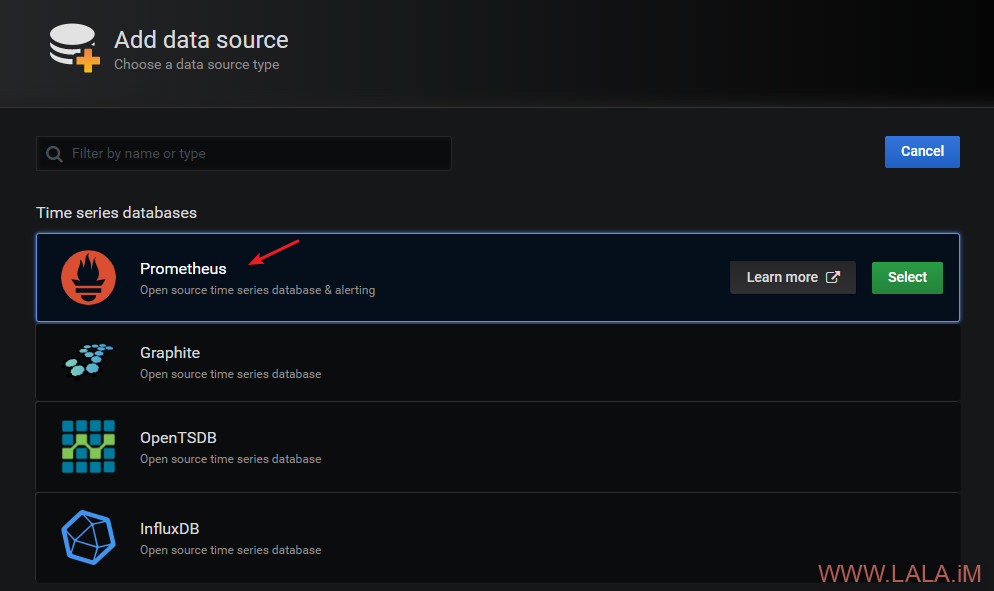
访问你的VPSIP:3000应该能看到grafana的WEBUI,默认的管理员账号密码都是admin。登录进去之后,你需要添加数据源:
如果你之前没有改动过docker-compose.yml内的服务名,那么这里应该填写:
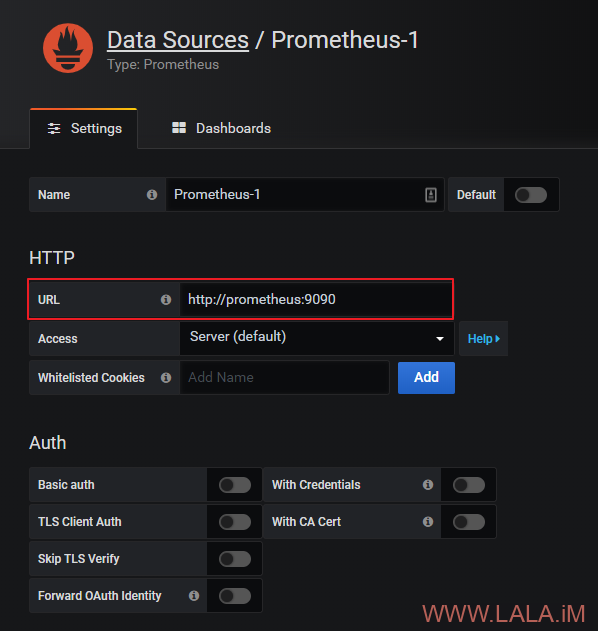
其他的保持默认即可,然后点击Save & Test,测试没问题的话就OK了。
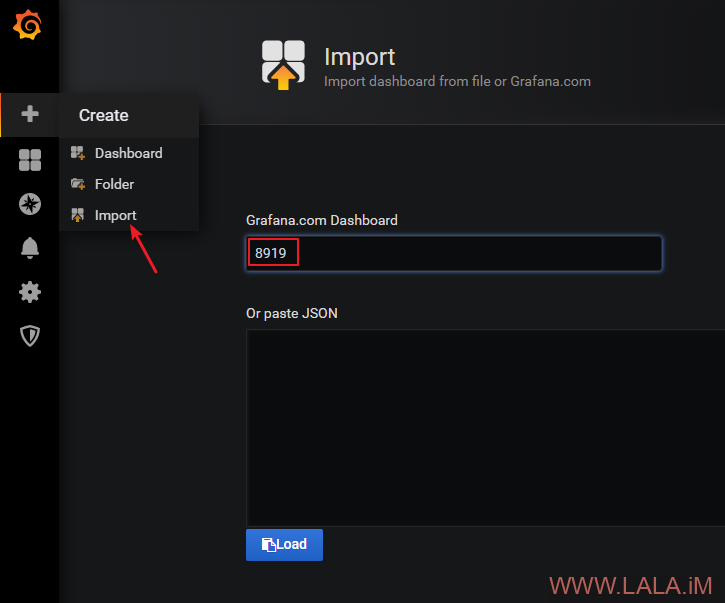
现在你需要新建或者导入模板,自己新建的没有人家现成做的好,这里直接导入别人的模板就行:
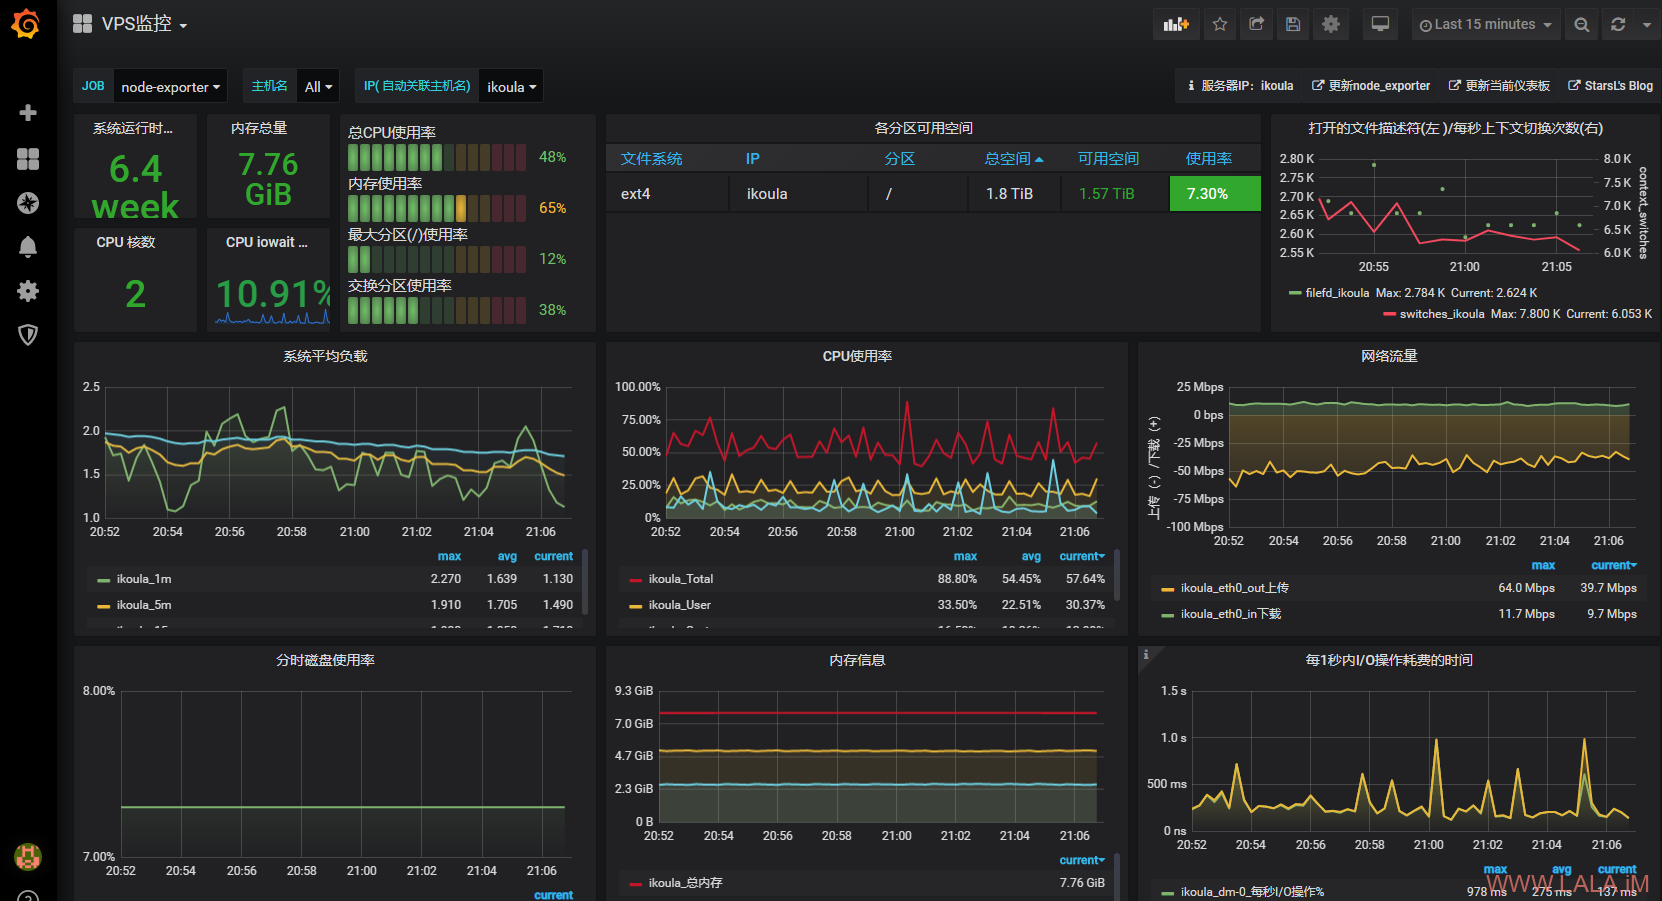
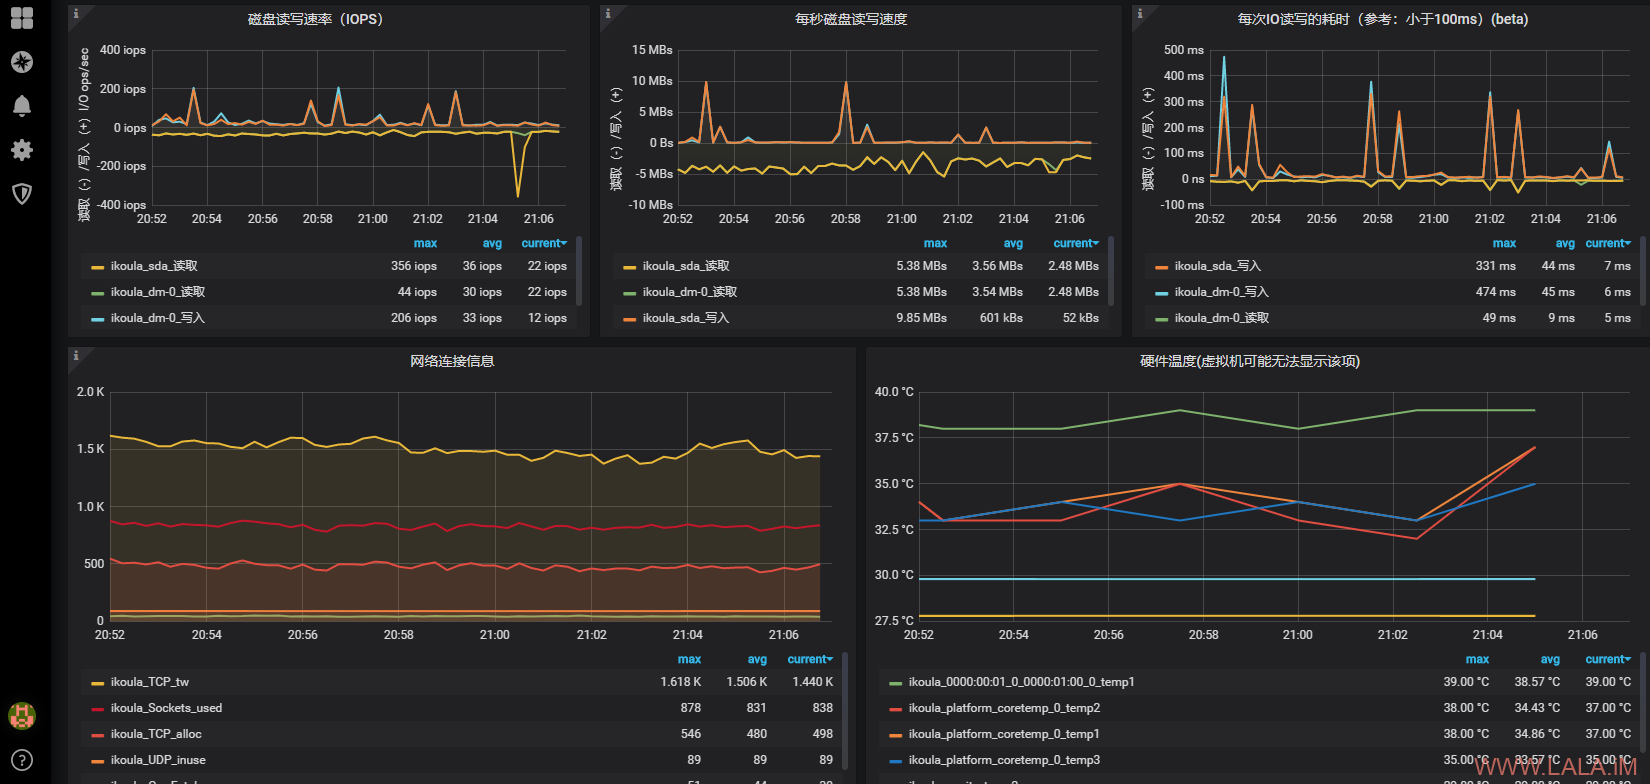
一些预览:
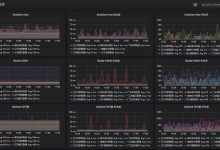
预览2:


lala为什么用V2ray电脑端进不了你网站,而用手机端却能进?
安装完成后添加Prometheus数据保存时出现HTTP错误错误网关
检测宿机是不是一样操作?
我们高端用户从不监控,坏了就扔,扔了再买
这么华丽吃不吃资源?
服务端和节点都不吃,节点20M内存就可以运行node_exporter。
Xshell 6官方推出特别正版公开注册码,免费3个月可以用,有订阅Xshell 官方邮件就可看到,或者gooogle可知,博主可广告
我去了解一哈,我一直还在用Xshell5
官网https://www.netsarang.com/en/free-wfh-license-covid19/
lala,我v2ray也进不来
我这一直都是正常的呀
手机用V2ray可以进来,PC端V2ray进不来,这问题很久之前就是这样。
那就不清楚了,我这v2ray都挺好的,没这个问题。。
电脑端V2不全局不行,规则有问题。
运行的时候显示Cannot open self /usr/local/bin/docker-compose or archive /usr/local/bin/docker-compose.pkg
楼主好,请问在GUI里面如何建立alert呢?谢谢
这个我还没设置过,我也不是很清楚。。
一直没有数据是怎么回事
检查下防火墙开了相关端口了么。
电脑端V2不全局不行,规则有问题。
没有服务端/客户端认证的相关介绍,不同小鸡部署的话,不安全
看了下官方,客户端需要nginx的密码配置,然而这种认证方式太古老,不安全
lala能不能写一篇 在这篇文章的情况下 配置grafana https的文章
traefik就可以了,搜下我博客其他用docker安装的程序,把里面的配置复制出来就能用了。
‘你小鸡的VPS公网IP:9100’
老哥,请问这里是不是不能监控私有IP?
可以监控任意ip,但前提是prometheus能访问到才行,就这篇文章里面的‘你小鸡的VPS公网IP:9100’这个配置,这里是可以填内网ip的,因为这个配置只监控本机。
好的,感谢。刚才我用centos7.9试了没问题,用8919模板的时候看不到流量,其它都正常,换ubuntu在添加数据源的时候报错。Error reading Prometheus: Post “http://prometheus:9090/api/v1/query”: dial tcp: lookup prometheus: Try again 大佬有解吗
这个我就不是很清楚了。。没遇到过,要不你换个模板试试看。
这个问题搞定了,是docker的问题,用这个curl -sSL https://get.docker.com/ | sh 提示密钥有问题,我用yum install docker后面就再报错了。
镜像那里我修改了下image: grafana/grafana:8.4.4 最新的版本界面有点奇怪。
它死活不显示上下行带宽,监控的主机我用的是ESXI虚拟的多台主机。
我在公网上也有一台监控小鸡,用的grafana版本同样是8.4.4,模板同样是8919,添加同一台被监控小鸡,它就能正常显示上下行带宽,内网的那台就不行。
8919模板一样,gr版本一样,被监控的小鸡也一样,结果不一样。。。
Instant 取消这个勾选可以显示带宽,不过一下子显示很多行
hostloc 过来的,跟着弄了一下感觉还行 。就是操作比较麻烦
  ,核心部分换成了脚本操作
  . 文章底部添加了原文链接,希望大佬不要捶我
https://iitii.github.io/2022/07/14/1/