
我大概一年多以前水过几篇搭建VPS三网监控平台的文章,当时用过的组合是:
1.Grafana+InfluxDB+Collectd
2.Grafana+Prometheus+blackbox_exporter
这次用到的是:Grafana+InfluxDB+Telegraf,并且为方便部署Grafana和InfluxDB这次直接用Docker。
Prometheus+blackbox_exporter的方案我当时部署起来用了没多久就放弃了,blackbox_exporter采集的数据貌似有点问题,不符合我的需求。
InfluxDB+Collectd其实还不错,但配置起来很麻烦,毕竟Collectd不是InfluxData亲生的。而Telegraf和InfluxDB都属于InfluxData旗下的产品,自然配置起来会方便很多。
InfluxData著名的TICK架构(Telegraf, InfluxDB, Chronograf, Kapacitor)全家桶说的就是它啦。当然我们这里是用Grafana代替了Chronograf,因为Chronograf和Grafana比起来的话,那差的可不是一点半点。
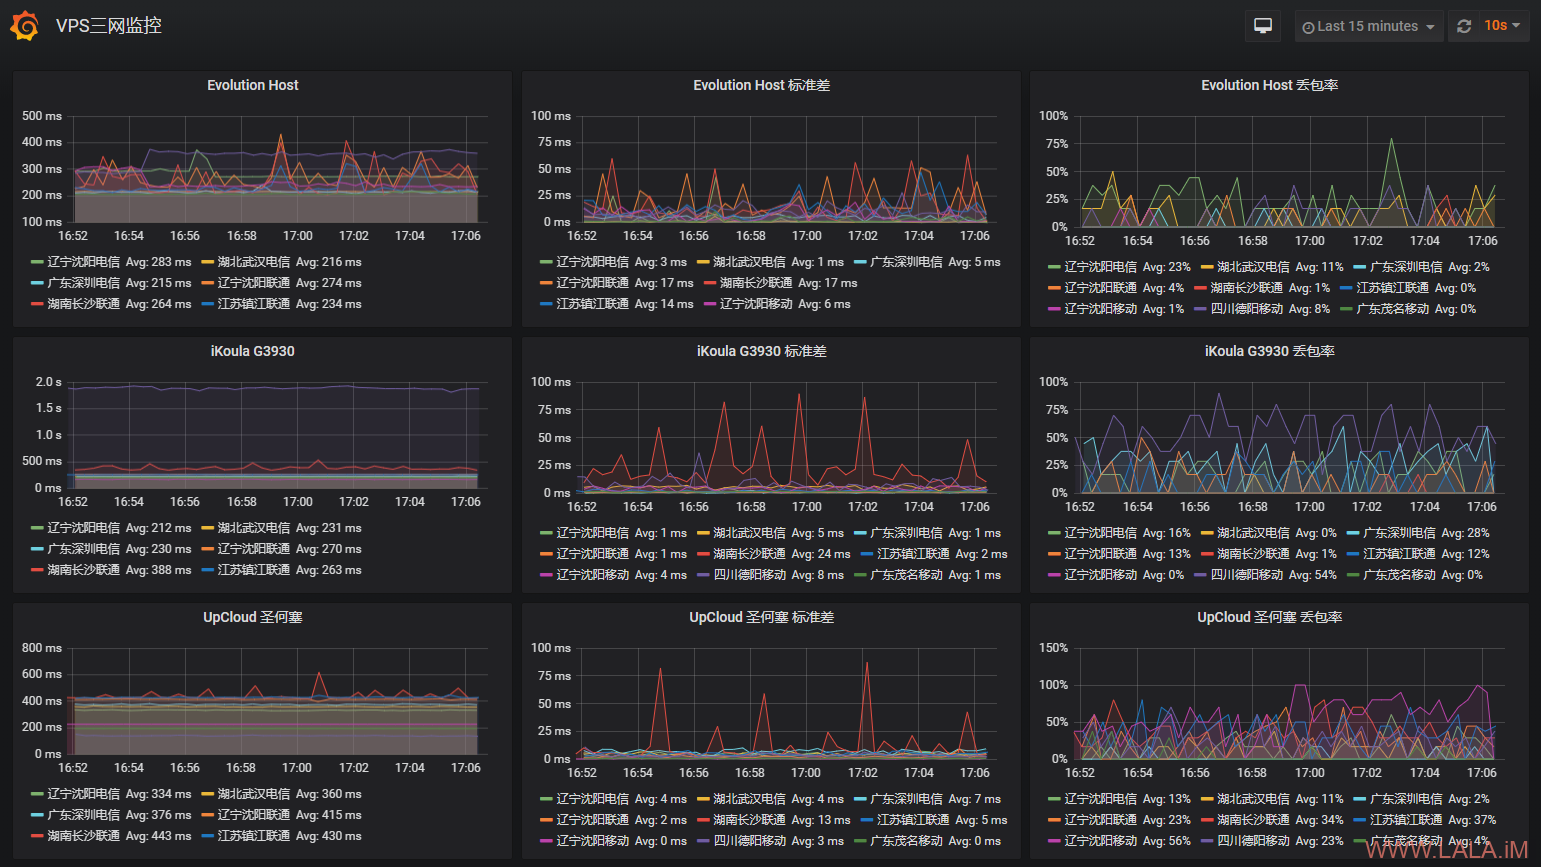
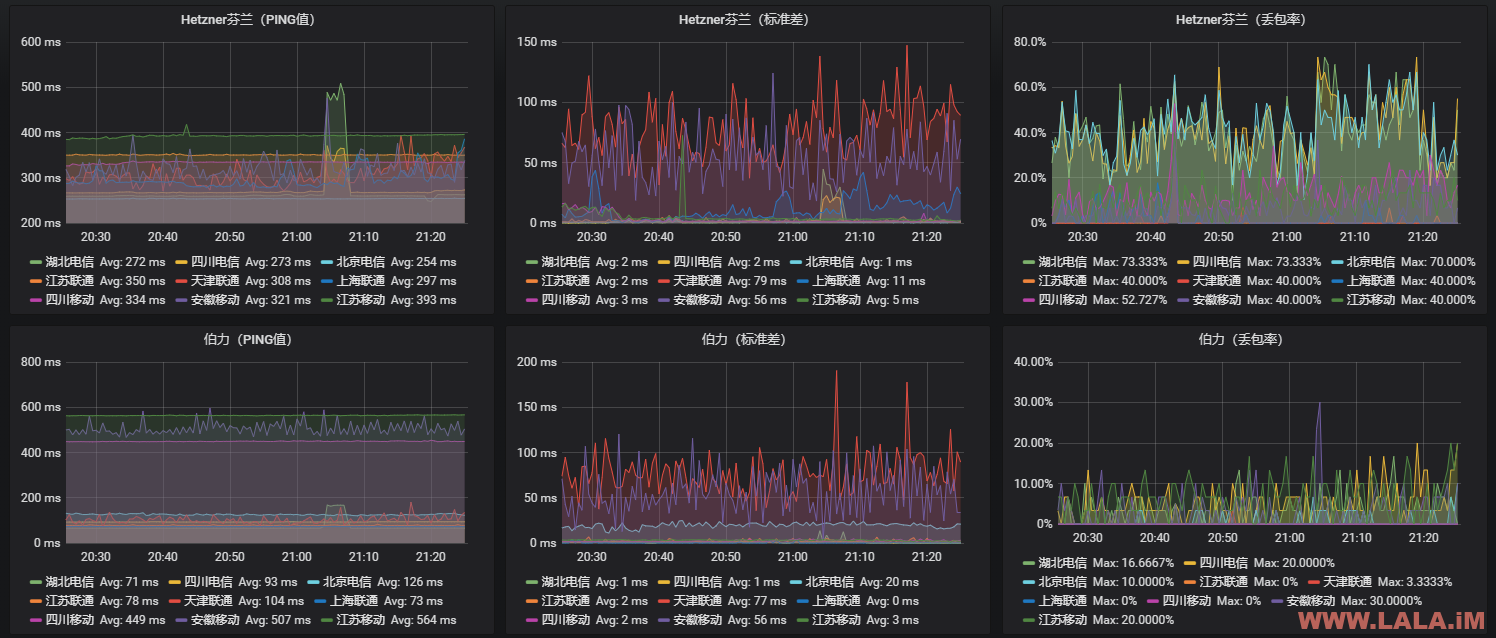
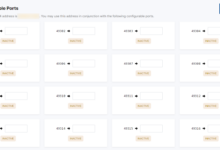
上一张预览图:
安装docker/docker-compose:
apt -y update
apt -y install curl
curl -sSL https://get.docker.com/ | sh
systemctl start docker
systemctl enable docker
curl -L https://github.com/docker/compose/releases/download/1.25.4/docker-compose-`uname -s`-`uname -m` -o /usr/local/bin/docker-compose
chmod +x /usr/local/bin/docker-compose
新建docker-compose:
mkdir -p /opt/pingmonitor && cd /opt/pingmonitor && nano docker-compose.yml
写入如下配置:
version: '3.5'

volumes:
    grafana-data:
    influxdb-data:

services:
    grafana:
        image: grafana/grafana
        container_name: grafana
        environment:
            - GF_AUTH_ANONYMOUS_ENABLED=true
        ports:
            - 3000:3000
        volumes:
            - grafana-data:/var/lib/grafana
        restart: unless-stopped

    influxdb:
        image: influxdb
        container_name: influxdb
        environment:
            - INFLUXDB_HTTP_AUTH_ENABLED=true
            - INFLUXDB_DB=telegraf
            - INFLUXDB_ADMIN_USER=admin
            - INFLUXDB_ADMIN_PASSWORD=password
            - INFLUXDB_USER=telegraf
            - INFLUXDB_USER_PASSWORD=password
        ports:
            - 8086:8086
        volumes:
            - influxdb-data:/var/lib/influxdb
        restart: unless-stopped
注:
1.GF_AUTH_ANONYMOUS_ENABLED是方便公开你的仪表板给别人访问。
2.INFLUXDB_ADMIN_PASSWORD设置HTTP身份验证的账号密码。
3.INFLUXDB_USER_PASSWORD设置数据库用户的密码。
确认无误后up起来即可:
docker-compose up -d
访问你的IP:3000打开Grafana,默认的管理员账号密码均是admin,登录进去之后添加数据源:
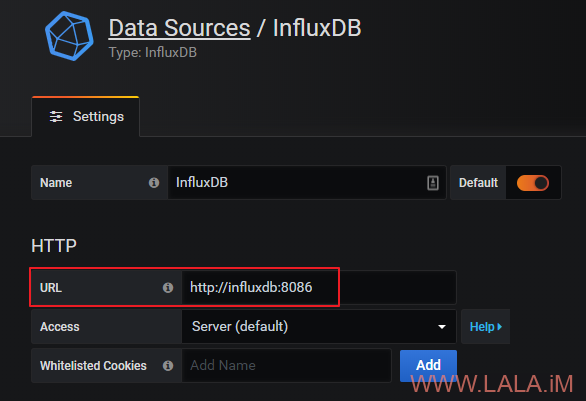
勾上BasicAuth并填写INFLUXDB的HTTP身份验证的账号密码:

接着填写数据库信息:
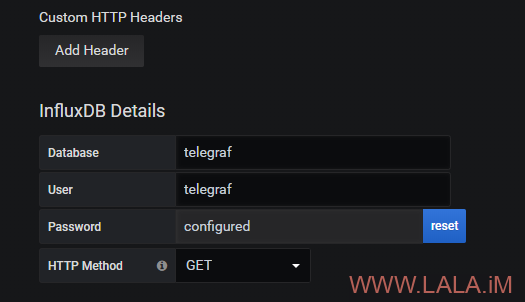
保存测试,没问题的话现在Grafana和InfluxDB就部署好了。
接下来在每台需要监控的VPS上安装Telegraf,Telegraf是用于监控主机系统的,不建议使用Docker安装,所以这里采用添加源的方式安装在每台机器上:
apt -y update && apt -y install apt-transport-https wget gnupg
wget -qO- https://repos.influxdata.com/influxdb.key | apt-key add -
echo "deb https://repos.influxdata.com/debian buster stable" | tee /etc/apt/sources.list.d/influxdb.list
apt -y update
apt -y install telegraf
其他系统,如CentOS可以参考官方的文档安装:
https://docs.influxdata.com/telegraf/v1.14/introduction/installation/
编辑telegraf的主配置文件:
nano /etc/telegraf/telegraf.conf
修改数据库连接信息,服务器IP是搭建InfluxDB机器的公网IP,注意这里的账号和密码不是数据库的而是InfluxDB的HTTP身份验证账号密码:
[[outputs.influxdb]]
  urls = ["http://服务器IP:8086"]
  database = "telegraf"
  username = "admin"
  password = "password"
接下来新建一个监控项目的配置文件:
nano /etc/telegraf/telegraf.d/ping.conf
写入如下配置:
[agent]
  interval = "20s"
  flush_interval = "20s"
  hostname = "iKoula G3930"

[[inputs.ping]]
  urls = ["219.148.253.225","58.49.233.254","183.56.167.125","60.16.96.1","103.38.43.1","122.194.47.117","211.137.47.109","117.174.59.1","120.237.53.17"]
  count = 5
  ping_interval = 1.0
  timeout = 1.0
注:
1.注意修改hostname用于区分不同的机器。
2.测试IP都来自ipip.net的路由追踪,每个IP的地理位置:
辽宁沈阳电信
219.148.253.225

湖北武汉电信
58.49.233.254

广东深圳电信
183.56.167.125

辽宁沈阳联通
60.16.96.1

湖南长沙联通
103.38.43.1

江苏镇江联通
122.194.47.117

辽宁沈阳移动
211.137.47.109

四川德阳移动
117.174.59.1

广东茂名移动
120.237.53.17
配置好了后启动重启telegraf/设置开机自启:
systemctl restart telegraf.service
systemctl enable telegraf.service
现在回到Grafana就可以新建仪表板了,由于没有现成的模板,这里只能自己手动创建一个了。
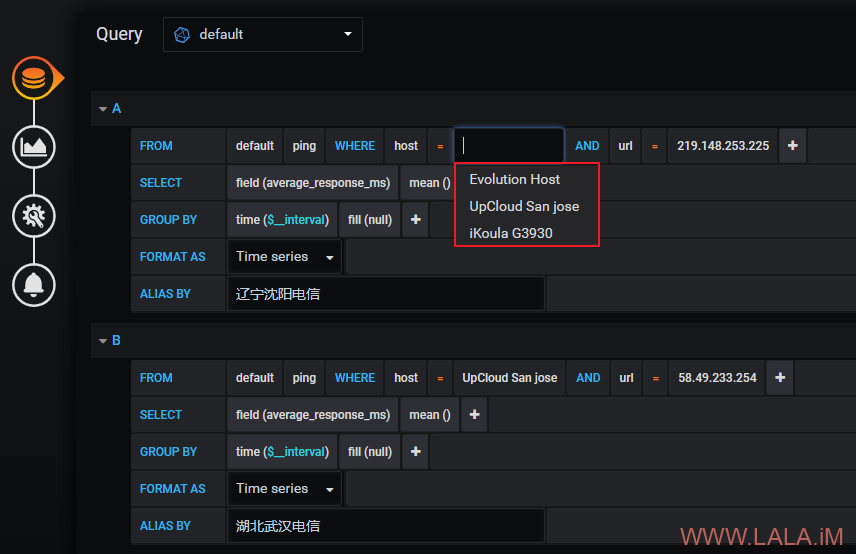
先来绘制PING值数据,按照下图的方式先把SQL查询语句构造出来:

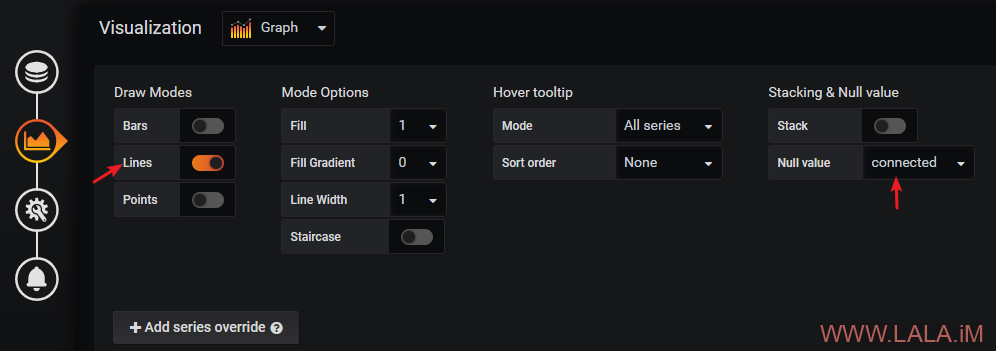
图表这块选择Lines,Null value选择connected:
Left Y的单位选择ms:
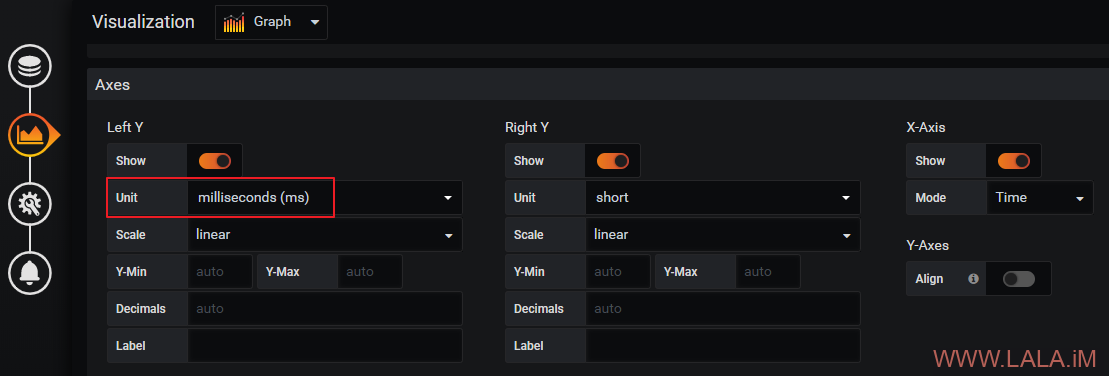
勾选Avg显示出平均值:
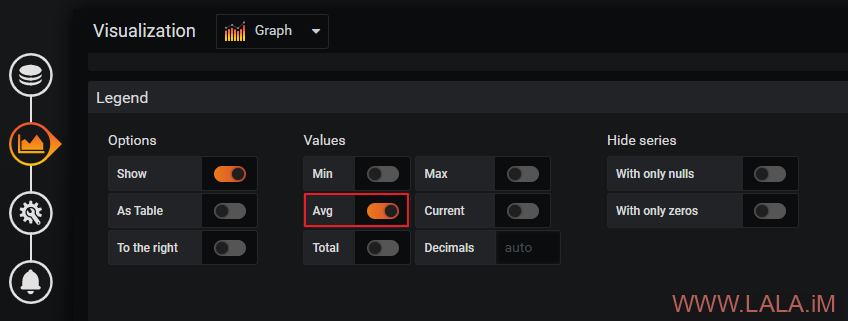
设置该面板的标题和描述:
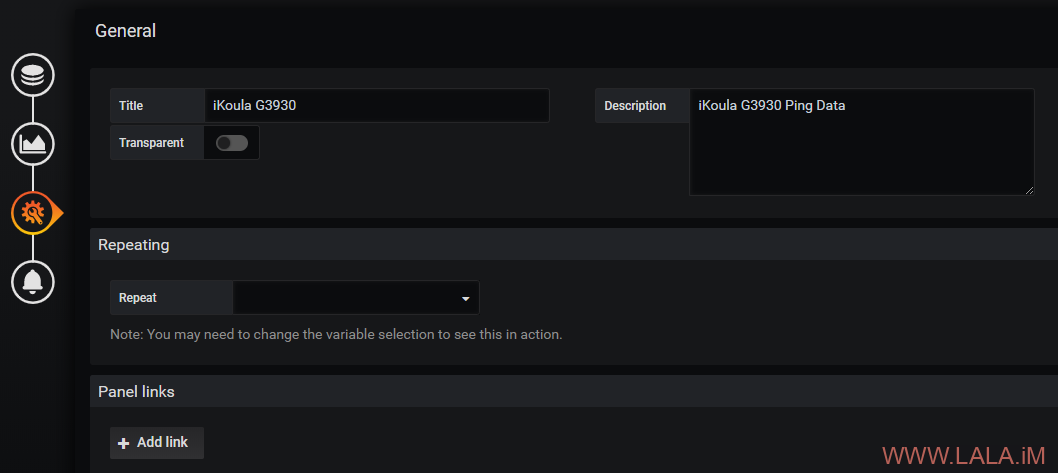
其他的可以根据自己的需求改,差不多保存就可以了。
接下来绘制标准差,之前已经创建好了一个面板,所以这次我们就可以直接偷懒复制出一个面板:

只需要把SELECT修改为field (standard_deviation_ms)即可:
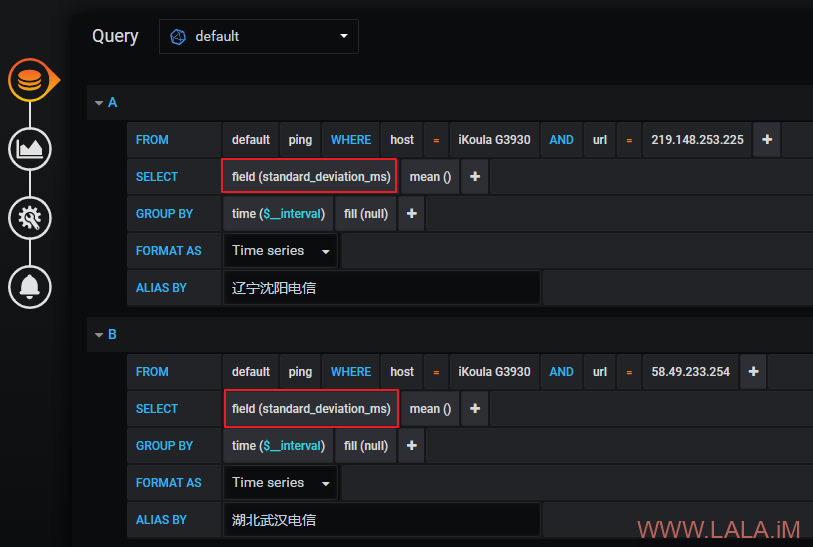
其他的可以和之前的保持一致。
最后再来绘制一个丢包率,还是按照之前的老套路复制一个面板出来,把SQL查询语句改为:
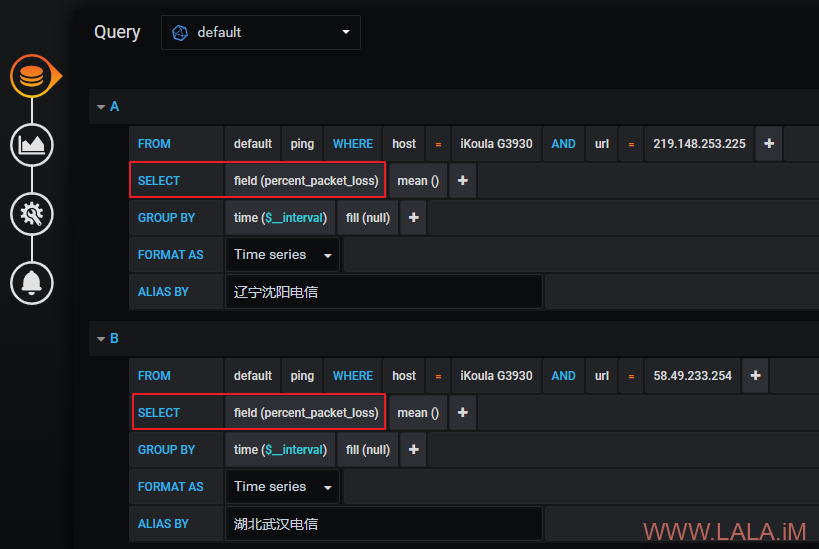
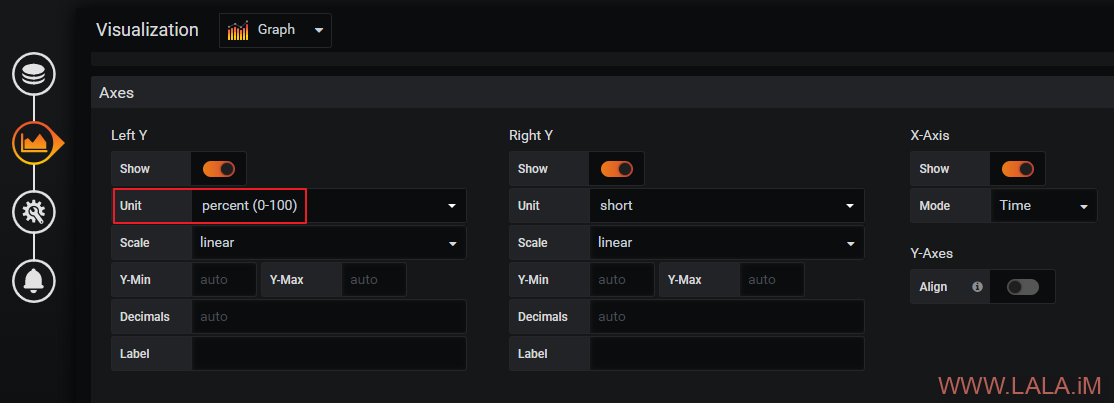
Left Y的单位改为percent(0-100):
不同的主机还是按照之前的套路复制一个面板出来,更改一下SQL查询语句内的Host就能展现出数据了:
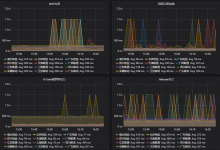
Telegraf默认还启用了CPU/Disk/Network/Kernel等其他数据的采集,有兴趣的话你也可以自己创建其他的仪表盘。


![Senbonzakura [SS-Extended+Bass]-荒岛](https://lala.im/wp-content/uploads/2017/06/23688165-220x150.jpg)
lala,不如把你博客底下的“一言”出个教程吧,前些天看到别人弄的毒鸡汤好好看哦。无奈自己不会弄
https://developer.hitokoto.cn/sentence/demo/#%E7%BD%91%E9%A1%B5
这个粘贴到你的博客就能用了。
监控脚本对我是有仇吗?每次弄都不成功的
可以试试更简单的netdata。
迪厅已boom
域名到期了,忘记续费了。。。。。
好棒! 但是好麻烦的样子

其实只要你新建好了一个面板后,后面的设置基本就是复制粘贴。。。
谢谢~我去尝试一下,不过我使用yum install docker(即apt-get docker)安装的,应该版本比文中的新,请问会有影响吗
Unsupported config option for services: ‘influxdb’


Unsupported config option for volumes: ‘influxdb-data’
没事了,没事了,我的问题 ,代码copy漏了
grafana上没有data出来,when writing to [http://***]: database “telegraf” creation failed: 404 Not Found,telegraf status报错显示这个……啊,吐血了

issue closed

多打了一个斜杠
emmm 我也是NO date
emmm,你再仔细检查看看是不是哪里配置错了
可以的,这股折腾劲要保持
保存测试,没问题的话现在Grafana和InfluxDB就部署好了。
保存的时候 提示 登陆 http://ip:3000 你与此网站的链接不是私密链接 输入 配置的所有密码 还是提示
Network Error: Unauthorized(401)
填你设的这个环境变量的密码:INFLUXDB_ADMIN_PASSWORD